Economic and Social Development
Economic and social Development
Syllabus -
Meaning of Economic and Social Development. Human Development
Index (HDI) and Human Poverty Index (HPI).
Characteristics of Indian Economy : Before and After Independence.
Census of India : Economic and Social features.
Population growth and economic development. Issues related to Role of
women in Economic and Social Development in India.
Impact of globalization on Indian society : Poverty and Development.
Poverty-line and Programmes for eradication of Poverty in India.
Schemes for Rural and Social Development - Welfare and Developmental
Programmes including Self Help Groups (SHGs), MNREGA and
community power structure.
Sustainable development and Inclusive growth.
National Income - Measurement and composition.
Regional imbalances and income inequalities in India : Steps taken by the
Government to reduce it.
Meaning of Economic and Social Development (HDI)
Human Development Index (HDI)
Human Poverty Index(HPI); it is replaced by Multidimensional Poverty in 2010
Multidimensional Poverty Index(MPI)
Characteristics of Indian Economy : Before and After Independence
Census of India : Economic and Social features
Characteristics of Indian Economy : Before and After Independence
The economic history of India shows a number of distinct phases over the period it fell under the colonial control to the modern times when it embarked on economic reforms. Before the formal onset of the British colonial rule in India after the battle of Plassey in 1757, India was among the richest countries of the world. According to some estimates during the Mughal period India was the second largest economy having a share of almost 25% of the world economy. Two centuries of the exploitative British colonial rule led to India's wealth being drained away and the process of 'deindustrialisation' taking a heavy toll on the people of India. The great nationalist leader Dadabhai Naoroji was the first person to systematically highlight this aspect of the colonial exploitation. His analysis laid the theoretical foundation for the freedom struggle culminating in India's independence in 1947.
At the time of independence, India inherited a stagnant economy. Between 1900-1950, the
real GDP growth rate of India was almost zero. The independent India embarked on a process of economic reconstruction and growth by adopting the model of planning. The beginning was made with the Mahalnobis-Feldman model which aimed to build the capital goods industry to lay the foundation for self-reliant growth in India.
However, beginning the 1980s winds of change had started blowing across the world in the form of greater international economic integration in the process of globalisation. India realised that its growth rate, sarcastically dubbed the 'Hindu growth rate' of close to 3% annually, was far too low to sustain the expanding aspiration of its people. The distortion in the planned economic process was glaringly reflected in the 'license-permit raj' that empowered the rent seeking class of bureaucrat-contractor-politician to extract surplus from the system. This was the period when economic reforms were initiated, prompted in no small measure by the expanding sphere of finance capital in the world economy.
The process of economic reforms picked up momentum by the early 1990s as India had to undergo structural adjustment in order to avoid defaulting on its international obligations towards debt repayment. The reforms moved apace to include opening up of the economy, decontrol and significant changes in the financial and banking sectors. The
transition from the public sector attaining the 'commanding heights of economy' to the 'market driven open economy' has been a complex and multi-layered process. The transition has indeed resulted in an accelerated GDP growth rate of above
5% for the period 1991-92 to 2003-04 and above 6% for the period 2003-04 to 2011-12. Fall in the poverty ratio, improvement in the FDI and better forex reserves have also been noticeable achievements of this period.
However, this period has also been marked by an increase in the level of inequality in the country. According to a study 'in both the early 1990s and the early 2000s the wealthiest 10% of wealth-holders held at least 50% of total assets, while the least wealthy 10% held at most 0.4% of total assets'. In case of land, it is more unequally distributed than wealth as a whole. The ownership of financial assets is even more concentrated, as 'almost all financial
wealth is held by well below 1% of the population'. It needs to be highlighted that inequality in resource endowment also culminates into inequalities of opportunity which defeats the purpose of inclusive development that India has adopted as a stated objective of its economic policy. There has also been a serious concern about employment generation in the period of economic reforms. The robust growth rate has not really been accompanied with improvement in the employment generation. Similarly, share of manufacturing sector in the GDP has also been quite low at 16%, putting a structural constraint on the future prospect of growth with employment.
Indeed, the rights based model of inclusive development could be successful only when we are able to bring in larger and larger number of people in the 'circuit of capital' for their productive integration in the process of creation of national wealth. After all, the famous economist Joan Robinson has rightly remarked that 'what is worse than being “exploited” is
not to be exploited at all!'
Economic Growth In India – Performance and Prospects
The most comprehensive
indicator of economic
growth in an economy
is the average annual
growth in real Gross
Domestic Product(GDP) that is originating within the
geographical boundary and measured
at constant base period prices. It would,
therefore, reflect average incremental
availability of goods and services
produced domestically in the economy
over time. When the growth of real
GDP is adjusted for the population
growth, it gives the average annual
growth of per capita real GDP and
reflects closely the improvements in
standard of living enjoyed by people
in the economy on an average over
time. This is particularly valid for
large countries where the cross border
flows of goods and services are limited
in relation to the amount produced
within the geographical boundary.
These three average annual growth
rates in: (i) real GDP, (ii) population
and (iii) per capita GDP (PCI) are
very significant parameters to reflect
the performance and prospects of
economic development in any country
over fairly long time period.
History of economic growth in
India is both interesting and educative.
Comparable time series estimates of
real GDP in India can be stretched
back till the year 1900 for meaningful analysis (Sivasubramonian, 2004; and
Hatekar & Dongre, 2005). There is
considerable research on attempting
periodization of the economic growth
history in India to gain insights about
policy regimes and factors determining
the performance of the economy
over long periods of time (Hatekar
& Dongre, 2005; Balakrishnan &
Parameswaran, 2007; and Dholakia,
2014). Accordingly, there are five
distinct phases so far in the history
of economic growth in India: (i)
1900-1901 to 1950-51; (ii) 1950-51
to 1980-81; (iii) 1980-81 to 1991-92;
(iv) 1991-92 to 2003-04; (v) 2003-04
to 2011-12.
The growth performance during the
first phase when the country was under
the last 50 years of the British rule was
the worst during all the phases so far.
Real GDP grew at around 1 per cent
annually and so did the population.
As a result, the per capita real income
almost stagnated for the first fifty
years of the last century in India.
Since the last fifty years of the British
rule in the country were perhaps the
best period for the Indian economy
under their rule of about 190 years in
terms of development of all physical
and social overhead capital such as
railways, ports, schools, colleges,
hospitals, banks and other institutions,
it can be safely assumed that the
stagnation of real living standards of people observed during 1900-51
was perhaps the phenomenon during
the entire period of 190 years of the
British rule in the country. These
two centuries of stagnation ensured
that one of the richest countries in
the world luring everybody by its
wealth and prosperity turned into one
of the poorest countries by the year
1950-51.
The stagnation of real per capita
income for such a long time also
had other implications. Under such
circumstances, if anyone becomes
better off, it cannot happen without
someone else becoming worse off,
because it becomes a zero sum game
under stagnation. Therefore, in the
society people started looking at
progressing few with suspicion that
they would have been involved in
some wrong doing to become rich
by depriving others or snatching
opportunities from others making them
poorer - a perception that continues
even today! Social and cultural barriers to entrepreneurship became stronger
and economic growth in the nation
further suffered. Moreover, long
stagnation in the living standard of
masses implies that their consumption
pattern would not change significantly,
and because there would be hardly any
innovations or technological progress
in the system, people would continue to
consume the same products throughout
their life with little diversity and
change. Rate of product obsolescence
and depreciation was very small and
the culture of preserving things by
recycling, saving resources and using
outdated technology with low material
costs was widely prevalent.
After achieving independence, it
was a major challenge to break out
from such vicious circles of low level equilibrium. Committing ourselves to
achieving self-sufficiency in general
and the socialistic pattern of society by
adopting both economic and physical
planning through creation of public
sector undertakings and imposing
numerous controls, licenses and
high taxes, during the second phase
(1950-81) we achieved the breakthrough
largely through public sector
interventions. In terms of managerial
decision to buy or make, the national
commitment to self-sufficiency
implied complete focus on import
substitution without consideration to
cost of production. It was consistent
with the export pessimism subscribed
by most of the leaders of those days.
Although our share in world exports
started falling significantly, the real
growth of GDP increased to about 3.5
per cent annually over the 30 years
period, 1950-81. Because of a sharp
fall in the death rate due to improved
provisioning of primary healthcare
infrastructure in the rural areas, the
growth of population also increased
substantially to about 2.2 per cent
annually and the per capita income
registered annual growth of meagre
1.2 per cent. It marked an increase
of about 2.5 percentage points in the
annual growth of real GDP, but only
about 1.2 percentage points in per capita real GDP.
The need for reforms in economic
policies was duly recognized in India
in the early 1980s, not substantially
lagging behind China. Several
economic reform measures got initiated
during the 1980s with exchange rates
adjusting continually for differences
in the inflation rates, change in
the approach of monetary policy
to monetary targeting, instituting
new institutions in financial sector,
announcement of long-term fiscal
policy, reducing quota requirements
in selected commodities, focusing on
telecom & information & technology
sector, etc. The economic growth
during the third phase( 1980-81 to 1991-92) further picked
up from 3.5 per cent to 5.1 per cent
annually and the population growth fell
to about 2 per cent. Per capita real GDP,
therefore, started growing at more than
3 per cent annually during the 1980s.
The fourth phase(1991-92 to 2003-04) saw accelerated
pace of implementation of some
systematic economic policy reforms
in various segments of the economy
such as fiscal policy, autonomy of
the Reserve Bank of India (RBI),
commercial policy, capital markets,
aviation sector, banking and insurance
sector, etc. Sequencing of the reforms
was meticulously done starting with
privatizing selected sectors by allowing
participation by the private sector into
those activities reserved hitherto for
only the public sector undertakings,
liberalizing economic activities by
abolishing licensing requirements,
gradually reducing protection by
cutting tariff rates to integrate domestic
economy with the international
economy, allowing foreign direct
investments in the economy and
finally allowing domestic players to
go global and become multinational
companies. The growth of real GDP
further increased during this phase to
6 per cent and per capita real GDP to
more than 4 per cent annually.
During the last phase so far
covering the period 2003-04 to 2011-
12, although no major economic reform
took place, the economy was allowed
to consolidate and adjust to the reforms
already made initially for 5-6 years.
However, during the last 4-5 years,
some reforms got reversed effectively
by introduction of new controls,
regulations, approval requirements,
bans, environmental and ecological
balance oriented clearances and so on.
Favourable global factors prior to the
year 2008 coupled with easy monetary
policy and movement towards fiscal
consolidation resulted in high growth.
Annual growth of real GDP increased
further to 8.4 per cent and per capita
real GDP to more than 6.5 per cent.
Interestingly, critical areas of pending
reforms such as labour reforms,
land market reforms, foreign direct
investment, direct & indirect taxation
reforms, expenditure reforms and so
on are yet not satisfactorily addressed.
These represent the opportunities for
future growth of the economy.
Prospects For Indian Economic
Growth
In the recent past, the best economic
performance of the Indian economy
was achieved during the year 2007-08.
It is important to note some relevant
parameter values during the year
because they have been actually
achieved by the nation in not too
distant past and, therefore, can easily be
achieved again. It represents the lower
bounderies on the potential existing
in the economy. In 2010-11, we came
very close to achieving several of those
parameter values, which indicates the
feasibility and practicality of such a
potential existing in the economy at
present.
In 2007-08, the Indian economy
clocked the growth of 9.3 per cent in
real GDP at factor cost, exports growth
of 29 per cent in dollar terms, inflation
rates of 4.7 per cent (Wholesale Prices)
& 6.2 per cent (consumer prices),
foreign exchange reserves of $310
billion equivalent, average exchange
rate of Rs. 40.3 per dollar, current
account deficit of only 1.3 per cent
of GDP, combined fiscal deficit of 4
per cent of GDP, combined revenue
deficit of 0.2 per cent of GDP and
primary surplus of 0.9 per cent of GDP. Thus, the year 2007-08 was
outstanding in all relevant performance
parameters except consumer inflation.
This was made possible primarily
because domestic savings rate and
domestic investment rate reached their
respective peaks at 36.8 per cent and
38.1 per cent of GDP. The Incremental
Capital Output Ratio (ICOR) reflecting
the efficiency of converting capital
formation into growth of output was
around 4.1.
The performance of the economy
slipped on all these parameters sharply
after the year 2007-08. International
developments in terms of financial
& confidence crisis of 2008, increase
in commodity prices including oil
prices, Eurozone sovereign debt
crisis, etc. led almost all developed
economies into severe recession and
most of the developing economies to
a significant slowdown. Both fiscal
and monetary boosts were provided
all over with a significant collaborative
effort to emerge out of such a slump.
Indian economy could fast recover
and emerged out of the slowdown
initially in terms of regaining the
growth momentum, but failed to reign
in the inflation, twin deficits on fiscal
& current account, steep depreciation
of the currency and loss in foreign
exchange reserves. Public sector
savings fell sharply from 5 per cent
of GDP in 2007-08 to 1.3 per cent
in 2011-12. Savings of the private
corporate sector also fell from 9.4 per
cent of GDP in 2007-08 to 7.2 per
cent in 2011-12. As a result, overall
savings rate in the economy fell by 6
percentage points to 30.8 per cent of
GDP in 2011-12 from 36.8 per cent in 2007-08. Investment rate also
fell from 38.1 per cent of GDP in 2007-
08 to 35 per cent in 2011-12 and 32.3 per cent in 2013-14; and the
growth of real GDP came down to 6.2 per cent in 2011-12. ICOR increased to
5.6 indicating substantial deterioration
in the efficiency of capital resources
that can occur only if the investments
remain under or unutilized.
The government’s failure to take
several decisions of critical importance
and urgency to ensure proper utilization
of natural resources and capital
investments in areas of strategic
importance such as infrastructure provision, raw material supplies,
taxation, providing environmental
clearances, giving timely approvals
for projects with huge investments,
etc. resulted in sharply reducing capital
efficiency and consequently increasing
the ICOR in the system. From the
economy’s potential assessment angle,
all these factors are of temporary nature
and can get reversed very fast. If the
central government starts performing
by taking quick decisions and clearing
the pending cases of approvals, it
may not only provide good incentives
for additional investments from the
private corporate sector but also lead
to improvements in utilization rates of
existing projects. All this can result in
reducing the ICOR back to the level
achieved in 2007-08. Similarly, the
central government can reign in the
fiscal discipline soon to ensure a rise
in the public sector saving back to the
level of 2007-08.
Thus, achieving the domestic
savings rate of 36.8 per cent in near
future is very likely. Then, attaining
the investment rate of 38 per cent
is also quite feasible. However, the
future potential of India is far more
attractive, because India is among the
few economies currently in the world
enjoying the demographic dividend.
The proportion of population in the
employable age group of 20 years to
65 years is on the rise in the country
and is likely to continue rising till about
2027-28 as per the UN projections.
Thereafter it may stabilize for a while
and then start falling. To attain the
current level of the ratio, it may take
another 15-20 years because the life
expectancy in the country is also likely
to rise in the meantime, but the further rise would be necessarily slower as we achieve higher levels.
Since the dependency ratio would be falling in the country till
2027-28, domestic savings rate is most likely to rise further to
reach the levels already reached in south-east Asia of 40-42 per
cent of GDP. If the efficiency of capital resources is maintained
with the ICOR staying at 4.1, this in itself would generate an
annual growth rate of 10 per cent of real GDP. This is purely
domestically funded growth potential. We expect that such a
high growth momentum is most likely to attract huge foreign
investment in search of better returns and dynamic markets.
Similarly our companies would reach out to foreign destinations
to expand their markets. If we assume a net inflow of only 2 per
cent points, it would push our annual growth potential upward
to 10.5 per cent over a fairly long period unto 2050.
Population growth rate is likely to slow down considerably
and would be about annual 1 per cent on average. Then the per
capita real GDP is likely to grow at around 9 per cent annually.
This is a mind-boggling scenario where the per capita real
income would be doubling every 8 years. The availability of
goods and services would be increasing at an unprecedented rate
and so would be the consumption of people. With such a high
speed of expansion in the consumption basket, the consumption
pattern would be changing drastically and rapidly. The basket
would be highly diversified and ever changing. Rate of product
obsolescence and depreciation would be very high. Preserving
goods would not be found viable and feasible. Recycling of
products and resources could become a formal business but
affording it within the household could be almost ruled out.
Service sector, entertainment, information, communication,
research and development are the fields most likely to come to
prominence. In short, the first fifty years of the current century
are likely to be quite opposite to the first fifty years of the last
century in India.
In such a dynamic and fast pace of economic growth,
entrepreneurship and diversity of consumption would require
considerable resources devoted to research and development.
This would require qualitatively a much superior human
resource development strategy. For a business enterprise, to
survive and maintain one’s relative position, rapid growth in
labour productivity, technological improvements and emphasis
on exclusive products would be the key. Emphasis and reliance
on the private sector participation is likely to address most of
these concerns as a part of their self-interest.
Is India back to the Hindu Growth Rate?
India’s post economic
reforms growth has been
one of the most cited
examples by economists
in last many years.
A h l u w a l i a ( 1 9 9 5 ) ,
Srinivasan (2002), Stern (2004),
Virmani (2004), Tendulkar and
Bhavani (2007), Panagariya (2008),
Bhagwati and Panagariya (2012.) to
name a few are among some of the
leading contributors in this regard.
India was blamed for its inwardlooking
industrialization from 1950-90.
Growth got a new boost from India’s
macroeconomic reforms when it
moved from inward looking to outward
looking industrialization. This was in
anticipation of the policy makers that
Indian economy would achieve faster
economic growth. But, the growth in
the post reforms period has become
a matter of debate. Economists argue
that India is an open economy where
the Hindu Growth Rate is far from
the reality. To get an external linkage
in this particular paper, the Pearson
correlation coefficient (r) finds the
strength of the linear relationship
between the GDP Growth and trade
deficit in India.
Growth Rate vs. Hindu Growth
Rate
Economic growth is defined as the
steady process by which the productive
capacity of the economy is increased
over time to bring about rising levels of national output and income (Todaro
and Smith, 2003). Samuelson and
Nordhaus (2007) assert that economic
growth represents the expansion of a
country’s potential GDP or national
output. Soon after the independence,
Indian Economy was facing chronic
imbalances as part of colonial rule.
Indian economy was left with weak
industrial base, poor infrastructure and
static economy. India made the first
declaration of industrial policy in theirresolution dated 6th April, 1948 in
which both public and private sectors
had been given importance.
India followed the planning model
that was adopted in socialist countries
including former USSR. In tune with
the socialist central planning model,
India started its planning beginning
from 1951. However, the development
of industries was left in shadow during
first five year plan. The gloomy picture
of industrialization and sub normality
as part of industrial development can
be traced through the facts. According
to the 1st Five Year Plan, on the one
hand, factory establishments in the
country accounted for merely 6.6
per cent in 1948-49 as a proportion
of national income and on the other,
only 1-8 per cent of the working
population were engaged in these
establishments.
A new industrial policy statementwas announced on 30th April, 1956 (The Industrial Policy of year 1956 is known as ECONOMIC CONSTITUTION of the country.). It
was aimed at accelerating the process of industrialization and specifically
developing large scale heavy industries.
The new revised industrial policy
includes Schedule A and Schedule B.
Schedule A included industries which
were the exclusive responsibility of the
state - monopoly of the state. Schedule
B included mixed sector of public and
private undertakings. All the rest of
the industries were left for the private
sector to establish and operate.
The Second Plan(1956-61) was particularly in the development of the public sector. The plan followed the Mahalanobis model, an economic development model developed by the Indian statistician Prasanta Chandra Mahalanobis in 1953. Hydroelectric power projects and five steel plants at Bhilai, Durgapur, and Rourkela were established. Coal production was increased. More railway lines were added in the north east.The Tata Institute of Fundamental Research was established as a research institute.
The Third plan(1961-66) was largely devoted
to long run benefits and was in tune
with the objectives of increase in the
national output and income generating
huge employment. The focus was on the
development of capital and producer
goods industries. It also emphasized on
the development of machine-building
industries. However, the growth rate of
industrial output declined, initially at
slow pace and after that, it decelerated
sharply reaching stagnation levels.
This created serious concerns for
nearly three years when the economy
fluctuated. The year 1968-69 showed
a clear sign of recovery. Fourth Five
Year Plan (1969-74), was marked
by a very low growth in industrial
production of 3.9 per cent against the
targeted rate of 8-10 per cent.
Fifth Five Year Plan(1974-79), started in
1974, proposed to achieve growth
with the attainment of self-reliance.
The emphasis was on the industries
of core-sector like- iron & steel, nonferrous
metals, fertilizers, mineral
oil, machinery-building, coal and
others. The economy was faced with
pressures and the industrial growth rate
was low at 2.5 per cent in 1974-75.
It was 5.7 per cent in 1975-76 which
provided some relief for the economy.
Sixth Five Year Plan(1980-85) was started in
1980. Substantial policy changes were
announced during this plan. The Sixth Five-Year Plan marked the beginning of economic liberalisation. Price controls were eliminated and ration shops were closed. This led to an increase in food prices and an increase in the cost of living. This was the end of Nehruvian socialism. Industriallicensing and controls were relaxed
and import policy was more liberalized
than ever before. The result was that
growth was witnessed in industrial
production. Seventh Five Year Plan
was started in 1985.The emphasis
was on development with growth and
increase in productivity. The industrial
growth rate during this plan was 8.5
per cent against the target of 8.4 percent. Thus, it was successful on the
part of industries.
Ahluwalia (1995) pointed out
that the inadequacy of the growth
performance of the Indian economy
led Prof. Raj Krishna to coin the
much quoted phrase 'the Hindu rate
of growth, to specify the disappointing
trend of growth. The Hindu growth rate
has nothing to do with any specific
religion; rather it is a term that was
economic in nature. It was a caustic
remark on the socialist pattern that
was adopted by the government after
the Independence. It was an indication
of low and almost stagnant growth
of Indian economy during 1950s to
1980. The average annual growth rate
of GDP during this period was 3.5
per cent. The growth rate of GDP has
shown in table1:
GDP growth rate from 1950-1979
Decades GDP growth Rate
1950-59 3.3
1960-69 4.4
1970-79 2.9
1950-79 3.5
Virmani (2004), asserts that the
new economic policy introduced
in 1991-92 had changed the Indian
economy and pushed it from the Hindu
rate of growth to a new higher rate of
5 per cent-6 per cent, called as, new
Hindu rate of growth.
Slow-down Growth Linkages
Growth potential of Indian
economy can be gauged in two
ways: quantitative and structural. To
understand the quantitative aspects,
growth rates of different sectors and
overall GDP growth are considered.
But to understand the economy well,
structural aspects have to be considered.
Changes in sectoral distribution of
GDP give the more realistic account
on the part of economic growth of the
country. Agriculture dominated the
sectoral composition of the GDP till
1970. In 1950-51 agriculture and allied
sector’s share in GDP was 55.3 per
cent. Two decades of planning in India,
did not show any significant decline
in the share of agriculture and allied
sector. This was the manifestation of
the fact that industries were indeed in a
bad condition in India. The process of
industrialization was not smooth and
not contributing significantly.
Growth Trends after Reforms
The crisis of 1991 led the Indian
policy makers to think beyond the
policy of import substitution to outward
oriented export promotion model. The
Indian economy was integrated with
the economies of the world. Reforms
were initiated in industrial policy and
foreign investment policy, trade and
exchange rate policy, tax reforms,
public sector policy, financial sector
reforms, reforms in agricultural sector,
labor market reforms and others. The
results of these reforms were seen soon after the reforms. The GDP growth
rate which was merely 1.43 per cent
in 1991-92, increased to 5.36 per
cent in 1992-93.
Agriculture & Allied Sectors
Indian economy was heavily based
on agriculture. Its importance can be
evaluated on two grounds- share in
GDP and in employment. So there
is a need to address the problems of
agriculture. The low production and
productivity poses constraints on
the total output of agriculture. The
inefficiency on the part of agriculture
merits sound policy implications
and investments. A very alarming
characteristic of agricultural sector is
that real investment in agriculture, both
private and public, has been stagnant
(Ahluwalia, 1993). This, with other
structural factors, led to slow growth
in agricultural and allied sector.
Industry
The economic reforms were
more radical as far as industries
were concerned. Changes in the
policy framework gave a big boost
to industries. The major reforms
were the abolition of licenses to a
wide range of industries. Licenses
are required now only for some
industries. Industries have thus grown
significantly during the last two
decades after the reforms. Average
growth rate from 1991-92 to 2010-11
was 5.7 per cent with a peak growth of
12.17 per cent in 2006-07 and lowest of
0.34 per cent in 19991-92.
Service Sector
The service sector in India after
the reforms has dominated the sectoral
composition of GDP. The share of
services in 1991-92 was 43.9 per cent
which rose to 59.29 per cent in 2012-
13.There is a sharp increase in IT,
telecom, banking service, insurance,
entertainment and many more. But,
it’s also true that only few services
are performing well. Today, India is
well known for IT and IT-enabled
services (ITES), communication and
BPO. The growth of service sector
after the reforms shows a relatively smooth trend compared to agriculture
and industries. The growth rate which
was 4.69 per cent in 1991-92, started
increasing and witnessed double-digit
growth in several years.
Performance of Indian Economy
There are different phases of
growth of Indian economy. Before
1980s, there was relative stagnation
in the economy, with average growth
rate of GDP at 3.5 per cent. Partial
reforms were started during 1980s. But
total reforms were initiated only after
1991. The currency crisis of 1990s
compelled the policy makers to initiate
the reforms.
GDP started peaking after reforms.
External Linkages
Domestic sectors have been
discussed till now. To analyze the
economy completely, it is imperative
to understand the external linkages
of growth also, comprising exports
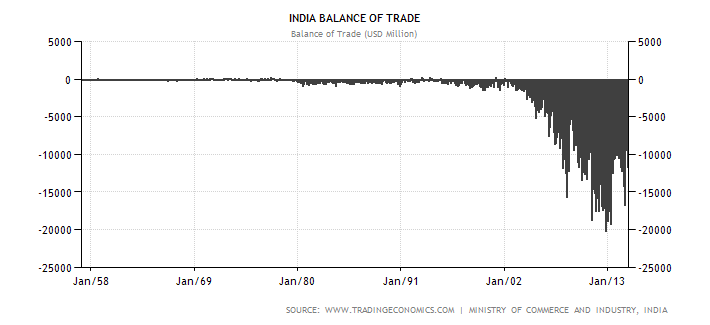
and imports. Trade balance remained
negative since long. There has been
trade deficit in the balance of payments
account. Below diagram shows trade balance
and GDP growth rates from 1957 to 2015.
The correlation coefficient between
GDP growth rate and trade deficit
is found to be 0.58. This indicates
that there is a moderate positive
relationship between these two. The
value of correlation coefficient shows
that when GDP increases, India’s
trade deficit also increases (though
moderately), indicating that the exports
are not responding as fast as compared
to imports. These growth rates indicate
that the reforms had certainly brought
more imports which has contributed
in our growth because such range
of growth rate (1991-2010) has not
been achieved by India before trade
liberalization started in 1991.
Recent Growth Trends
The Indian economy is facing
problems that are reflected through
the facts released by the Ministry of
Finance, Department of Economic
Affairs during recent couple of years.
Quarterly data released from 2010-11
to 2012-13 related to the growth rates
of agriculture & allied sector industry
and service sector have been shown
in Table 5.
Agriculture & allied sectors have
been performing poorly. This is the
most fluctuating sector – growth rates
have fluctuated between peak rates
of 11.0 per cent in quarter 3 (Q3) of
2010-11 to mere 1.2 per cent in quarter
2 (Q2) of 2012-13. Average growth rate
during this period was 3.4 per cent.
Industrial sector is also a matter of
concern for the policy makers and the
government. Industries have grown on
an average of 4.4 per cent during Q1 of
2010-11 to Q2 of 2012-13. However,
service sector shows a steady trend
during this period. Average growth
rate in this sector stood at 8.6 per cent.
Overall GDP growth rate during this
period was 6.9 per cent.
Conclusion
Compared to the pre reforms era,
Indian economy had much faster
economic growth in the post reforms
period. But, the recent revised forecasts
released by ADB and others on the
growth of Indian economy provide
a glimpse of slow down of Indian
economy.
Agriculture and allied sector is still
a matter of concern as it is the most
fluctuating sector in the Indian economy.